When individual amoebae of the cellular slime mould are starving, they aggregate to form a multicellular migrating slug, which moves towards a region suitable for culmination. We have modelled the process of culmination using a hybrid stochastic cellular automata (CA)/partial differential equation (PDE) model (Savill & Hogeweg, 1997, and chapters 3 and 4). Individual cells are modelled as a group of connected automata, i.e. the basic scale of the model is subcellular. Our model is an extension of the Glazier & Graner-model formalism (Glazier & Graner, 1993), in which cell displacements are driven by differential cell adhesions, combined with a sloppy volume conservation. We have added the following properties: cAMP signalling, chemotaxis, cell differentiation and rigidity.
Our model is based on the following experimental observations. Periodic cell movements occur during aggregation and slug migration (Dormann et al., 1998), as well as during culmination (Durston et al., 1976). Although the movement mechanisms are still under debate (Wang & Kuspa, 1997), there is increasing experimental evidence that the coordinated upward movement of the cells is organised by a combination of a pulsatile cAMP excretion and a cAMP-mediated cAMP response, accompanied by a chemotactic response towards the cAMP (Verkerke-van, 1997). The cAMP waves originate in the prestalk A (PstA) region, which in both model and experiment is located in the uppermost part of the culminant. Then the cAMP signal is relayed by prestalk O (PstO) cells, which occupy the posterior part of the prestalk-zone, and by prespore cells, which occupy the lower part of the culminant (Williams et al., 1993; Kitami, 1984).
During culmination a unidirectional conversion of cell types takes place: PstO cells differentiate into PstA cells, and PstA cells into stalk cells (Sternfeld, 1992). We assume that contact between the cell types is required for this process, since cell induction has not been detected even at a distance of a few cell diameters (Williams et al., 1993). The newly created stalk cells produce a stiff extracellular matrix (Jermyn & Williams, 1991) and increase their volume by vacuolation (Watts & Treffry, 1976).
A special group of cells, which first appear during the slug stage (Jermyn & Williams, 1991), occupies the tip region of the downward elongating stalk (Sternfeld, 1992). Due to their position and the fact that the stalk elongates straight downwards, these cells are assumed to guide the elongation; they are therefore referred to as pathfinder cells (Jermyn & Williams, 1991). Although the symmetry in upward and downward motion is striking, neither stalk cells nor pathfinder cells respond to cAMP and no other clue as to the stimulus directing the downward movement has been found (Williams, 1997). Hence in our model, pathfinder cells simply differ from stalk cells in adhesion strengths. We start our simulations when stalk cell differentiation has just begun and a small number of pathfinder cells are positioned at the stalk tip.
In our model we have implemented only the above mentioned experimentally elucidated mechanisms. The CA is used to describe the individual cells, the PDEs are used to describe the cAMP dynamics. A more detailed description is given in the Methods section. Time and space are scaled so as to simulate realistic characteristics for the periodicity and signal propagation of the cAMP waves (Siegert & Weijer, 1989,1992).
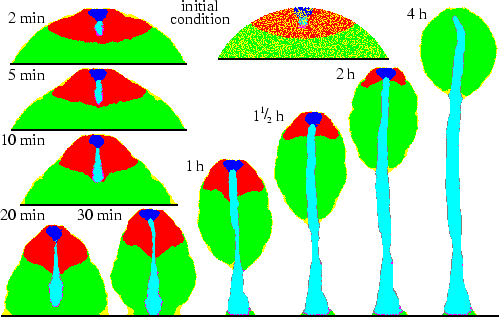
We now describe and explain the process of culmination as it unfolds in the model and refer to experiments in which comparable behaviour has been observed. Figure 5.1 shows that on a time-scale consistent with experiments (Higuchi & Yamada, 1984) a mound of cells develops into a fruiting body. As a result of the strong adhesion between the stalk cells and the much weaker adhesion between stalk and PstO cells, the stiff matrix produced by the stalk cells is `squeezed' outwards, where it accumulates at the boundary between the two cell types: very rapidly a stalk tube is formed (Williams et al., 1993). The top of the tube forms a gate through which prestalk cells can enter (Watts & Treffry, 1976). The gate remains open as a result of the combined effect of ongoing induction, differential adhesion and stiffness of the matrix. Periodically cAMP waves, originating in the PstA region, move downwards through the cell mass. These waves, combined with the chemotactic response, lead to the upward cell motion (Chen et al., 1995).
 |
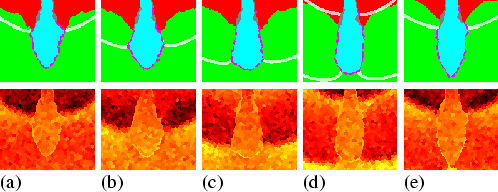
Due to the adhesion, the pathfinder cells immediately surround the stalk tip (Jermyn & Williams, 1991). Although neither the pathfinder cells nor the stalk cells are chemotactic, the tip elongates downwards at a greater speed than the chemotactic upward motion. The stalk tip reaches the base around 20 minutes after entering the prespore region, which is just as fast as observed in experiments (Sternfeld, 1992). The mechanism can be elucidated as follows (see Fig. 5.2): downward moving cAMP waves periodically trigger an upward directed chemotactic response. Because chemotactically moving cells push cells in front of them and pull cells that are behind them, pressure differences are created. Hence the cAMP waves are always accompanied by pressure waves, which are much broader. The pathfinder cells are pushed and pulled by these pressure waves, which results in a peristaltic motion of the stalk tip. The pathfinder cells, and along with them the stalk cells, are thereby squeezed downwards. Newly recruited stalk cells are transported through the tube by the combination of pushing at the tube gate, due to the surface tension between PstA and stalk cells, and pulling at the stalk tip, due to the peristaltic motion.
 |
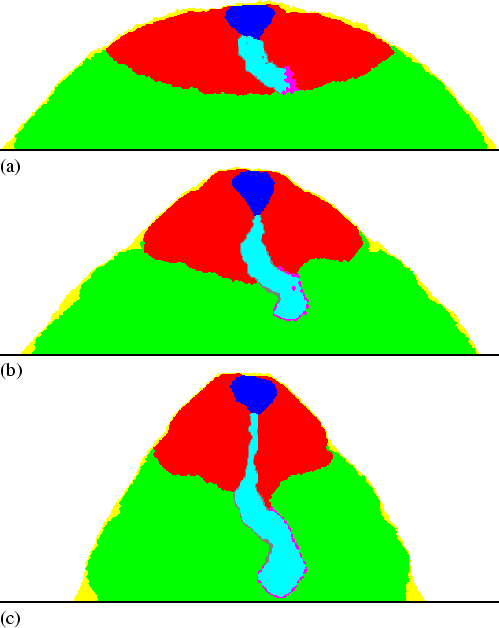
Although an elongated shape moving against a flow has a very strong tendency to bend sideways, the mechanism revealed by our model very efficiently restores any such deviation. Figure 5.3 shows that even if initially the stalk is bent 90 degrees, it extends downwards again after only 15 minutes. When the stalk tip is not precisely pointing downwards, the cAMP waves reach one side earlier. Hence, the moment this side is pushed, the other side is still pulled. This force efficiently transports the cells inwards, instead of downwards, and restores the original orientation. Peristalsis also explains the position of the pathfinder cells. When more than half of the pathfinder cells happen to be positioned along one side of the stalk, the imbalance is quickly rectified. This is because downward motion on the more crowded side is more efficient and pushes the cells back to the other side. Hence the pathfinder cells always remain positioned along the tip of the stalk, yet another property that is not explicitly incorporated in the model.
 |
The downward motion stops automatically when the stalk tip reaches the base, because the tip is no longer completely surrounded by cAMP waves. The upward motion of the prespore cells also stops in a self-organising way when the PstA cell type is depleted. The cAMP waves now also cease, because the PstA cells were the ones which periodically produced the cAMP signal. Therefore the upward motion halts at the moment the stalk formation is completed. After the chemotactic motion has stopped, the prespore cell mass becomes rounded, due to surface tension properties. The tube, however, is too stiff to change its general shape. Thus, in the model, a globule of spores on a slender stalk is the stable final configuration. The indirect mechanisms described here not only generate the normal culmination process, but they are also self-correcting and self-terminating. We therefore refute the claim in the literature that the stalk is pushed downwards as a result of the addition of stalk cells at the top (Jermyn & Williams, 1991; Thomason et al., 1999). Our model rules out this possibility.
Many other experimental observations are in agreement with our model. For example, when the differentiation of PstA cells into stalk cells is blocked, and hence no stalk is formed, in both model and experiments the culminant still moves upwards, but ends up as an erratic hair-like structure (Harwood et al., 1992). In the model this is due to upward motion by chemotaxis, which does not stop because the prestalk pool is never emptied. However, the results of this experiment cannot be reconciled with the classical view that the cells are pushed upwards by the stalk elongation (Jermyn & Williams, 1991; Thomason et al., 1999). When the rate of chemotactic motion is reduced (Chen et al., 1995) or when upward motion is prevented by an extreme centrifugal force (40-50 G) (Kitami, 1985), no normal stalk formation is observed. The simple explanation provided by the model is that periodic upward motion is necessary for the downward elongation. In experiments a constriction develops at the base of the prespore zone before the stalk reaches the substratum (Chen et al., 1998). In the model this is due to the combination of cellular adhesion and upward motion.
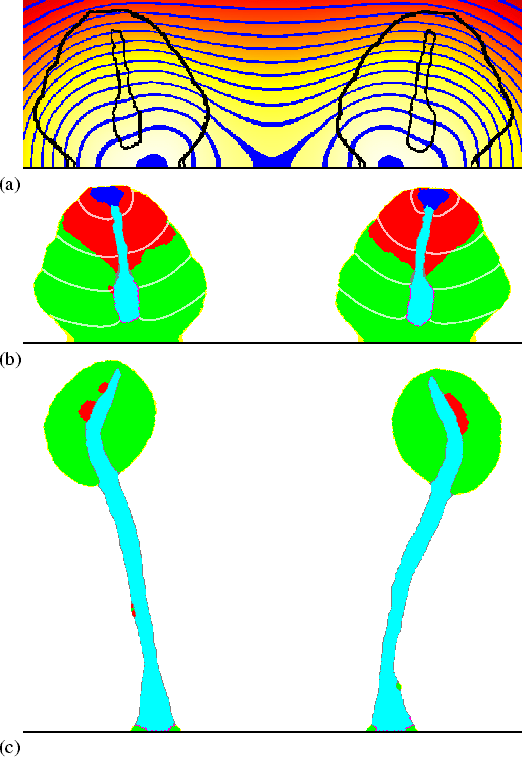
Finally, culminants orientate away from ammonia (NH3) (Bonner et al., 1986), as well as away from each other, apparently because they themselves produce NH3 (Feit & Sollitto, 1987). Figure 5.4 shows how this behaviour can be accounted for: the cells produce a small quantity of NH3, which inhibits the cAMP-induced cAMP release (by inhibiting the activation of adenylate cyclase, Williams et al., 1984); NH3 accumulates between the two adjacent culminants, and because cAMP waves move more slowly at higher NH3 concentrations, the waves become slanted. The stalks, which extend perpendicular to the cAMP waves, move towards each other instead of straight downwards, and the fruiting bodies end up orientated away from each other.
 |
We have previously used the same model-formalism, including the same processes of differential adhesion, cAMP signalling and chemotaxis, to explain the aggregation of single amoebae into a mound and a moving slug (Savill & Hogeweg, 1997), as well as to unravel the mechanisms behind thermotaxis and phototaxis, which direct a slug to a suitable site for culmination (see chapters 3 and 4). These model studies together with the results reported in this paper demonstrate that the entire process of morphogenesis, except for the initiation and termination of the slug stage, can unfold without any need to change the parameters of these processes. Nevertheless many genes are up and down regulated during slime mould development, and much more is likely to become known about the genes involved in the near future. Many of these genes are certainly connected with processes not directly related to the cell movements, e.g. the maturation of spore cells. Evaluating the role of those genes that are involved in cell movement in the light of our model should generate interesting insights into evolutionary refinements and genetic robustness and should reveal how gene expression governs macrolevel phenomena. For example, it should be possible to interpret the aberrant phenotypes created by restriction enzyme-mediated integration (REMI) (Smith, 2000). Note that our model is completely defined at the (sub)cellular level, whereas the mechanisms at work are on larger scales, ranging from individual cells to slugs, to culminants, and finally even between culminants. We have demonstrated the feasibility of such multi-scale modelling for explaining the mechanisms involved in Dictyostelium discoideum morphogenesis. Undoubtedly, a similar approach could be adopted to unravel the mechanisms underlying other types of developmental processes (Hogeweg, 2000a).
We have modelled the culmination using two-dimensional simulations,
which are considered to be transverse sections. We used the
Glazier & Graner-model (Glazier & Graner, 1993), extended in the
following way. Each cell has a unique identification number, ![]() ,
which is assigned to circa 30 automata in the stochastic CA. Each
cell also has a type label
,
which is assigned to circa 30 automata in the stochastic CA. Each
cell also has a type label ![]() , which indicates whether the cell
type is prespore, PstO, PstA, stalk or pathfinder (
, which indicates whether the cell
type is prespore, PstO, PstA, stalk or pathfinder (![]()
![]() {Psp,
PstO, PstA, St, Pf}). Each automaton that is part of a cell's
boundary has a number of dimensionless free energy bonds, given by
J
{Psp,
PstO, PstA, St, Pf}). Each automaton that is part of a cell's
boundary has a number of dimensionless free energy bonds, given by
J![]() ,
,![]() > 0. The values of
J
> 0. The values of
J![]() ,
,![]() are
given in Table 5.1. The total free energy of a cell
is given by:
are
given in Table 5.1. The total free energy of a cell
is given by:
H + + |
(5.1) |
|
J |
#cells | V | cAMP | |||||||||
| Psp | 20 | 11 | 9 | 1960 | 30 | relay | ||||||
| PstO | 27 | 14 | 13 | 7 | 1011 | 30 | relay | |||||
| PstA | 33 | 16 | 13 | 10 | 3 | 79 | 30 | oscill. | ||||
| St | 43 | 20 | 25 | 24 | 16 | 3 | 25 | 30-40 | decay | |||
| Pf | 35 | 8 | 10 | 10 | 17 | 7 | 11 | 14 | 30 | decay | ||
| Sl | 5 | 7 | 8 | 15 | 21 | 21 | 7 | - | 1 | 3000 | decay | |
| Tu | 5 | 9 | 10 | 11 | 12 | 3 | 5 | 1 | - | 1 | 3×#St | - |
| Air | Soil | Psp | PstO | PstA | St | Pf | Sl | Tu | ||||
To describe the slime sheath and the stalk tube (![]()
![]() {Sl, Tu}),
two entities are defined which follow the same rules and can deform in
the same way as all cells. The stiffness of the stalk tube is
described by a high
Hdiss. The slime sheath has a fixed
volume; the volume of the stalk tube increases whenever a new stalk
cell appears.
{Sl, Tu}),
two entities are defined which follow the same rules and can deform in
the same way as all cells. The stiffness of the stalk tube is
described by a high
Hdiss. The slime sheath has a fixed
volume; the volume of the stalk tube increases whenever a new stalk
cell appears.
The induction of PstA cells into stalk cells is implemented by
searching at fixed time intervals (
![]() tinduction)
PstA-stalk cell contacts. The chance of changing one PstA cell into a
stalk cell is proportional to the amount of contact area. The
differentiation of PstO cells into PstA cells is modelled in the same
way. During the first 15 minutes after their appearance stalk cells
increase their target volume by 33%. Initially, the open space
between the cells is filled with slime mass; the slime then spreads
out over the cell mass, forming the slime sheath within a few time
steps.
tinduction)
PstA-stalk cell contacts. The chance of changing one PstA cell into a
stalk cell is proportional to the amount of contact area. The
differentiation of PstO cells into PstA cells is modelled in the same
way. During the first 15 minutes after their appearance stalk cells
increase their target volume by 33%. Initially, the open space
between the cells is filled with slime mass; the slime then spreads
out over the cell mass, forming the slime sheath within a few time
steps.
To describe the cAMP dynamics we use a discretised PDE with the same grid size as the CA. The cAMP can diffuse freely through all cells and through the slime sheath, but not through the tube, which is considered to be impermeable to cAMP, or into the air or soil. Excitable cAMP dynamics can be described reasonably well in a quantitative way by two variable FitzHugh-Nagumo equations with piecewise linear `Pushchino kinetics' (Panfilov & Pertsov, 1984). Here we have used the same equations and parameter settings as used previously (see chapter 3). Table 5.1 indicates which kinds of cAMP dynamics were used for the different cell types.
Provided their refractoriness is not too high, prespore and prestalk
cells respond to the cAMP signal by making a chemotactic movement
towards cAMP. Chemotaxis is incorporated by using the local cAMP
spatial gradient:
![]() H
H![]() =
= ![]() H -
H - ![]() (cAMPautomaton - cAMPneighbour). One Monte-Carlo step, during
which every CA is randomly updated once, corresponds to 0.1 seconds
and one grid point corresponds to 5
(cAMPautomaton - cAMPneighbour). One Monte-Carlo step, during
which every CA is randomly updated once, corresponds to 0.1 seconds
and one grid point corresponds to 5 ![]() m.
m.
In the simulation of Fig. 5.4, all prestalk and
prespore cells produce
1×10⁻³ NH3/second, which can also
diffuse into the air. The inhibiting effect of NH3 (n) on the
cAMP dynamics is incorporated by increasing the value of parameter
a![]() , n, which defines the excitability of the
cell (see chapter 4):
a(
, n, which defines the excitability of the
cell (see chapter 4):
a(![]() , n) = a
, n) = a![]() +
+ ![]() .
.
Parameters used are T = 6, ![]() = 1,
= 1, ![]() = 200,
Hdiss = 0.8,
Htubediss = 30, and
= 200,
Hdiss = 0.8,
Htubediss = 30, and
![]() tinduction = 8.5 seconds. In Fig. 5.4,
aPstA = - 0.20,
aPstO = aPsp = - 0.025,
bPstA = 0.0375,
bPstO = bPsp = 0.075,
p = 2, s = 3 and Dn = 15.
tinduction = 8.5 seconds. In Fig. 5.4,
aPstA = - 0.20,
aPstO = aPsp = - 0.025,
bPstA = 0.0375,
bPstO = bPsp = 0.075,
p = 2, s = 3 and Dn = 15.
We would like to thank Dr. S. M. McNab for linguistic advice. A. F. M. Marée was supported by the Priority Program Nonlinear Systems of the Netherlands Organization for Scientific Research.

