| 1. |
Study
Figure 2 of
Kiepiela
et al again.
What does this
result tell you about the relationship between CD8 responses to different HIV-1
proteins and viral loads?
|
| 2. |
Design
and
perform an analysis that can show that B*5703 and B*1801
target different HIV-1 proteins, ie. do they have different number (or
density)
of epitopes
from different HIV-1 proteins using the peptide
binding predictions:
NetMHCpan server (see hints 1&2). Focus on peptides of length 9 for this exercise and
assume that top 1% of the peptides (sorted based on binding affinity) is the set of predicted epitopes for each HLA molecule.
|
| 3. |
Compare your results to expected number of epitopes from each protein. In NetMHC output you can see easily
how many peptides of length 9 there are per HIV-1 protein. Remember: we are using the top 1% threshold to define potential
epitopes.
|
| 4. |
Study the binding motif of B*5703 and B*1801 using the Motif viewer link on NetMHCpan page. Can you now understand why these two HLA molecules present different HIV-1 peptides?
|
| 5. |
it has even been suggested that stability correlates better with immunogenicity than affinity does.
It is possible to predict the stability of peptide-MHC complexes (in terms of their helf-lives) using
NetMHCstabpan . Repeat the analysis
you performed for the binding affinities now for the stability of peptide-MHC complexes for HLA-B*5703 and B*1801.
Compare these results with your findings on the binding affinities.
|
| 6. |
|
Why
do you think it might be beneficial to
present HIV-1 Gag? To answer this question search internet/PubMed for more information mutability of HIV-1 proteins.
|
| 7. |
Now let us connect these results with what you learned on the lecture about Selective Sweep by SIV in chimpanzee populations by Prof. Ronald Bontrop.
Chimpanzee MHC alleles PatrB02 and PatrB03 were protective against SIV infection. Can you repeat the following analysis for those alleles using SIV proteins? Are they also preferentially presenting epitopes from Gag protein?
|
|
|
|
|
|
|
|
|

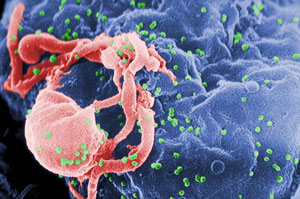
Scanning electron micrograph of
HIV-1 budding from cultured lymphocyte
|
|
|
- To find which MHC molecules target which HIV-1
proteins, you need to use a data set that contains all HIV-1
proteins. We have prepared such a file for you here.
Alternatively, you can generate your HIV-1 protein data set in many ways, e.g. you can search for the
HIV-1 genome at NCBI
and
via the protein coding regions download all protein sequences (use the
"Protein" link on the right hand side of the page under "Related Information" header. If you search for "Human immunodeficiency virus 1", it is easier to reach the genome assembly of HIV-1.
Under Summary option, at the top of the page, you can choose for "FASTA (text)" format and
download all the sequences at once). Make sure you
don't use concatenated proteins (e.g. Gag-Pol) for the analysis. If you have such sequences
check out the NCBI entry to figure out which positions contain Gag and which positions
contain Pol.
- To make MHC-peptide predictions upload a file in fasta format to NetMHCpan. Make sure that input type is set to Fasta.
To analyze the output of NetMHCpan
use the "Save output in XLS format" option, save the output (link is at the end of
the output page; using right
mouse button and "save as" option you can save the output). You can then use this output file in R
to analyse the results. Try this first self, and if you get stuck, you can
take a look at this help file. To make a prediction for a specific allele, choose under the Select species/loci menu HLA-B.
Remember
smaller the predicted binding value, the better the binding. If you are
creating your own fasta
files it should contain the protein names as the first word of the
identifier line.
- To analyse the relationship between chimpanzee alleles and SIV, you can use the protein
file we prepapred for you here. We have learned in the lecture that PatrB02 and PatrB03 alleles were protective with respect to SIV infections.
More information on the CTL responses generated by these alleles can be found in this article .
|